Bug #4801
openout of memory
0%
Description
ERROR: RecordingException: Unable to query data table: out of memory
I opened tpc01, ran it, closed it, opened tpc03-herbs, ran it, closed it, opened tpc03-large-herbivores, ran it, closed it, opened tpc03-woody, ran it, closed it, opened tpc09, ran it, and hit the above out of memory error. I have 68 runs in the wrm, but 63 of them are various iterations of the small test workflow for bug 4789. I also have those 5 Kruger KARs in a local repository and all the data for them is cached. I can start Kepler and run any of those workflows by themselves. I started Kepler with an ant run, so the jvm should have a 512MB memory max.
Kruger workflows: https://code.ecoinformatics.org/code/kruger/trunk/workflows
Kruger: r439
Kepler: wrp r23080
It may be worth looking at bug 4642.
Files
Related issues
Updated by Oliver Soong about 15 years ago
After getting the out of memory error, I generated a heap histogram, restarted Kepler, and generated another heap histogram. org.hsqldb.PointerNode looks good, as does org.hsqldb.CachedDataRow. There's no obvious class that's using all the memory, but I did notice that the number of ptolemy.kernel.util.NamedObj$SerializableObject jumps, as do ptolemy.kernel.util.NamedList and org.kepler.moml.NamedObjId. I'm guessing that there are multiple copies of the workflows floating around that aren't getting gc'ed. If I hook debug lines into the objectmanager and watch identityHashMap values for the various NamedObj receiving listeners, I can see 2-4 different java objects with the same name.
Updated by Christopher Brooks about 15 years ago
I suggest using JProfiler to track this down. They have a trial offer. Edward and I have licenses. I don't have the time to look at this particular problem in detail though.
My strategy is to first run the model in a headless environment and look for leaks there. First, just parse the model and look for leaks. Then, parse the model and run it. Then, try the graphical environment.
See ptII/ptolemy/moml/test/UnloadModelTest.java for code that loads a model, runs it and then sets the container to null. I recently tried this for a few models and did not see any leaks in a non-graphical environment.
BTW - one thing I found was that on the Mac, applets will always leak because there is a class suppplied by Apple that retains a reference to the something (if I remember correctly, it is the applet?)
Updated by Chad Berkley almost 15 years ago
I am not able to reproduce this in the kepler suite. I think this is a WRP/Provenance problem. I'm going to retarget this to 2.x so it can be dealt with after the 2.0 kepler suite release. Please reply if you don't agree with me.
Updated by Oliver Soong almost 15 years ago
There's another way to trigger a memory leak. I'm not sure if these are 2 different leaks or 2 symptoms of the same leak. The original description was to open, run, and close a number of workflows. This time, I had two workflows open, never ran either, and was editing one. Kepler proceeded to slow down, presumably due to repeated gc attempts, before crashing while re-opening after I saved my work.
Updated by Ilkay Altintas over 14 years ago
Related to 5095, but a specific form of it. Derik will review and try to regenerate the bug as an extension to 5095.
Updated by jianwu jianwu over 14 years ago
Madhu and I tried these workflows for a while and found that the memory usage goes up for opening and closing one workflow. Here is what we tried:
In reporting suite trunk, monitoring using Jconsole
1) open Kepler,
2) open one Kruger workflow (such as tpc01) from its Kar file
3) close it
4) execute Gabage Collection in Jconsole
5) the min memory after GC goes up for about 20MB
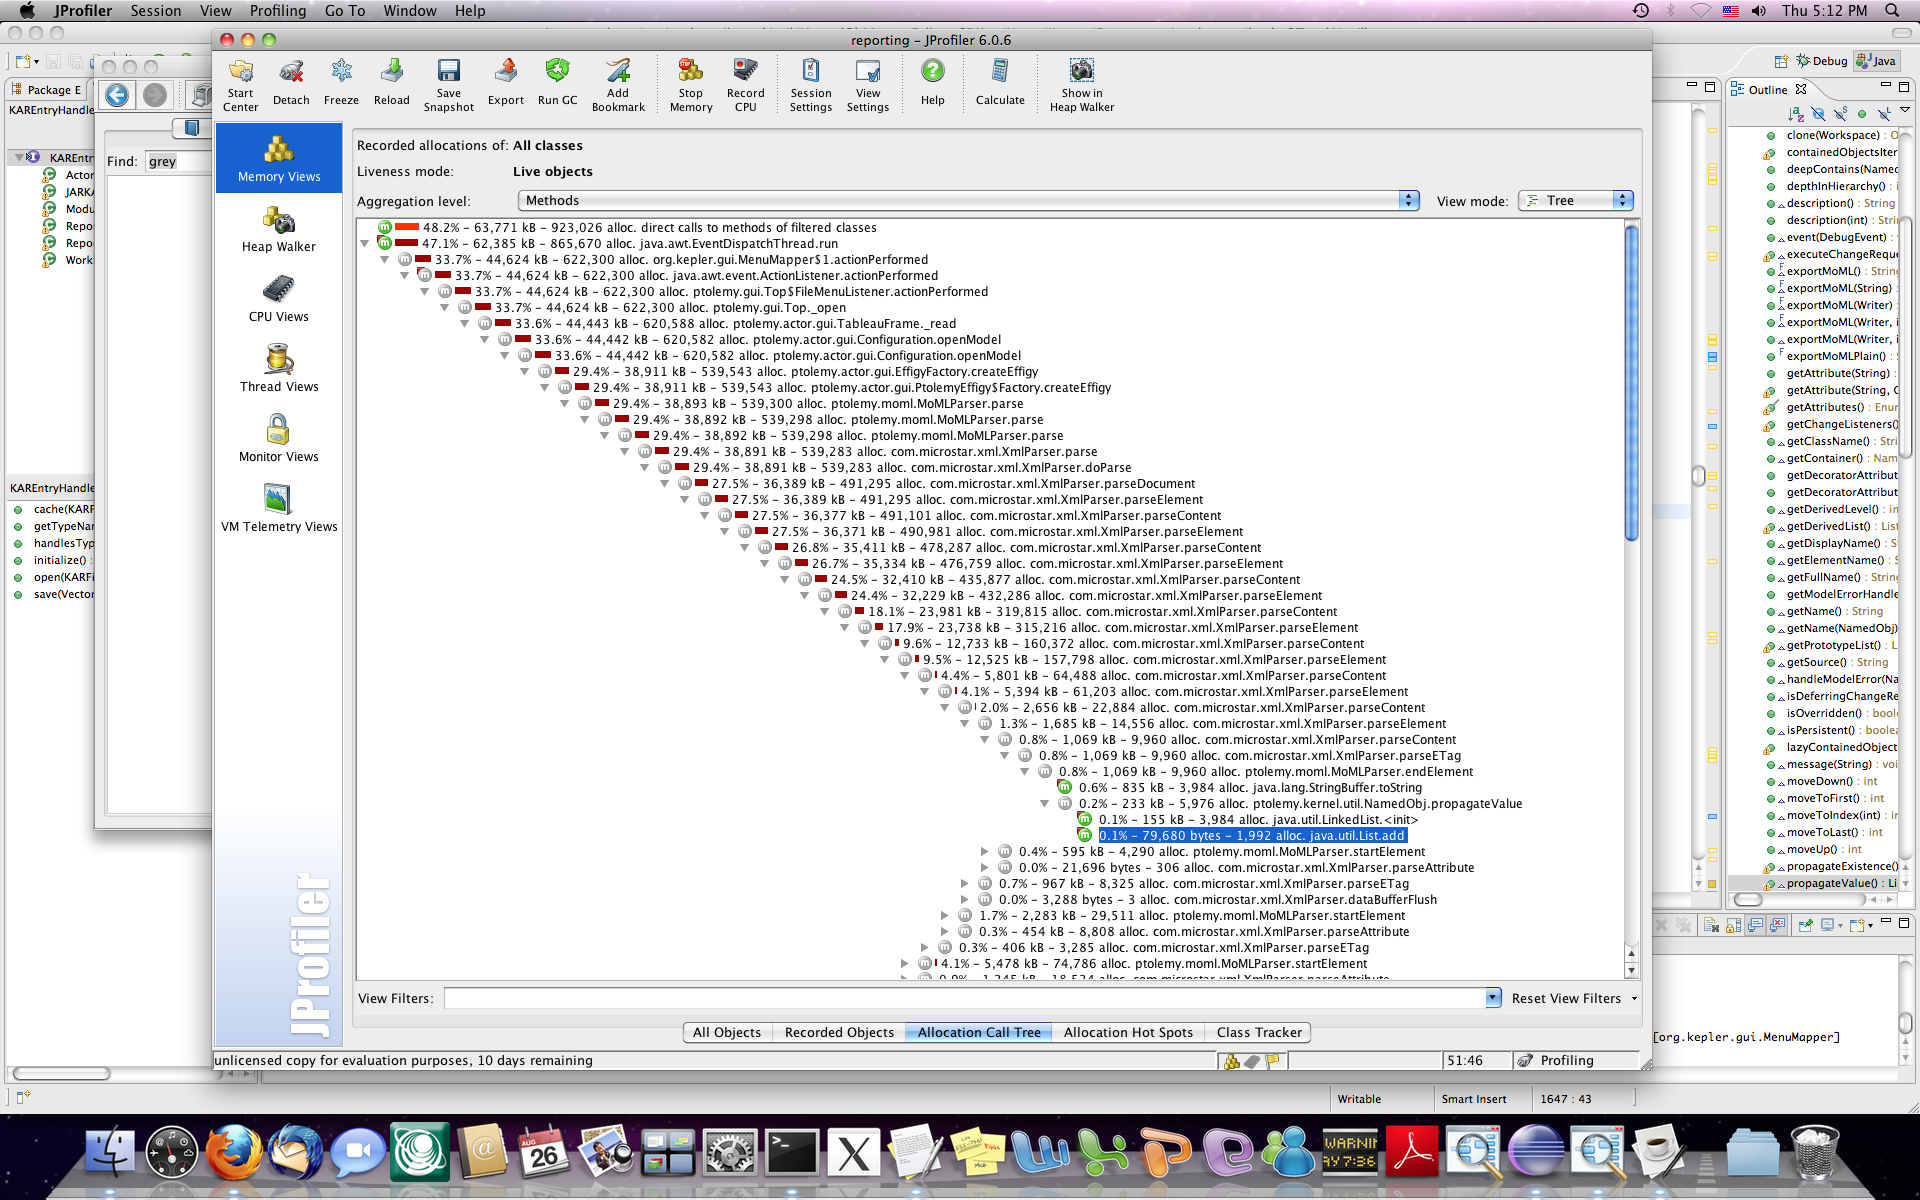
Also from the Allocation Call Tree view in Jprofile, the org.kepler.gui.kar.OpenArchiveAction.actionPerformed function always hold 20 MB (mainly for ptolemy.moml.MoMLParser.parse) even after GC.
We think these two are related, still investigating.
Updated by Christopher Brooks over 14 years ago
Below is some email about a leak worth looking in to.
--start--
Thanks for pointing this out as this is very timely because a bug
report for memory leaks in Kepler was just created.
AddEditorFactory adds a VisibleParameterEditorFactory named _editorFactory to
parameters that have a _location
The "8.1" test at ptolemy/moml/filter/test/BackwardCompatibility.tcl illustrates
what the filter does.
<property name="_location" class="ptolemy.moml.Location" value="355.0, 200.0">
        </property>
becomes
<property name="_location" class="ptolemy.kernel.util.Location" value="355.0, 200.0">
        </property>
        <property name="_editorFactory" class="ptolemy.kernel.util.Attribute">
        </property>
(The ptolemy.moml.Location -> ptolemy.kernel.util.Location is done by another filter.)
One possible solution would be to modify MoMLFilter so that we pass
the parser in as an argument. MoMLFilter is an interface, so we would need to
modify each of the filters or come up with a backward compatible method.
Another possible solution would be to get the toplevel and see if there
is a _parser attribute, see MoMLParser:
MoMLParser parser = ParserAttribute.getParser(_toplevel);if (parser != this) {
// Force the parser to be this one.
ParserAttribute parserAttribute = (ParserAttribute) _toplevel
.getAttribute("_parser", ParserAttribute.class);if (parserAttribute == null) {
parserAttribute = new ParserAttribute(_toplevel, "_parser");
}parserAttribute.setParser(this);
}However, I believe that _parser is set after the parsing is done, so this
might not work.
BTW - Do you have a simple test case for this?
Let me chew on this overnight. Edward, do you have any insight?
_Christopher
On 7/15/10 8:07 AM, Hudson, Brian R wrote:
Chris,
Jason Smith and I have spent the past few days trying to chase down why
our model(s) will not be garbage collected.It turns out that in our case it is caused by AddEditorFactory.
Under certain conditions AddEditorFactory creates a new static
MoMLParser that references the model and causesit to never be garbage
collected. Changing this to non-static alone isn’t enough as an instance
of AddEditorFactory resides in BackwardsCompatability’s static _filterList.We’ve worked around the problem for now (by removing AddEditorFactory
from BackwardCompatability._filterList).It also looks like the AddIcon filter would cause the same issue, though
we haven’t encountered this.Brian
--end--
Updated by jianwu jianwu over 14 years ago
Hi Christopher, thanks for your info.
To demonstrate whether the memory increase is because of the kar file opening, I switched to open directly from xml file, which turns out has the similar situation. After one workflow xml is opened and closed, the whole memory increased about 20 MB after GC.
From the Allocation Call Tree view in Jprofile, the memory hold by
ptolemy.actor.gui.PtolemyEffigy$Factory.createEffigy function always increases 15MB after each round, mainly for ptolemy.moml.MoMLParser.parse.
Updated by jianwu jianwu over 14 years ago
I uploaded the allocation call tree view at JProfiler after opening a workflow and closing it. Any suggestions on the possible reason is welcome.
Updated by jianwu jianwu over 14 years ago
More analysis shows that one reason for the adding memory is because some singleton classes do not release corresponding resources when a workflow is opened and closed.
Classes we found so far:
1) Vector<JTree> _trees and Map<String, VisibleTreeModel> libraryModels in LibraryManager class;
2) Vector<ViewPane> _viewPanes, Hashtable<TableauFrame, JPanel> _viewAreas, Hashtable<TableauFrame, JComboBox> _viewComboBoxes in ViewManager class
These variables only add new elements when a new workflow is opened, but do not remove elements when workflows are closed. Also these two classes hold references eventually connecting MoMLParser.
I add Aaron in the discussion since he is the original author of these two classes. He might have useful feedback.
Updated by jianwu jianwu over 14 years ago
I changed several hashmap/hashtable/vector variables in some static classes, one static hashmap variable in a normal class, one static linkedlist variable in one ptolemy class, explicitly removing useless objects after a window is close or using weak reference. Now the memory used by Kepler suite will not increase much after opening and closing big workflows. I'll do more tests on it. I can list my changes if anyone is interested. More bugs need to be fixed in reporting suite.
Updated by Daniel Crawl over 9 years ago
- Target version changed from 2.5.0 to 2.X.Y